ش
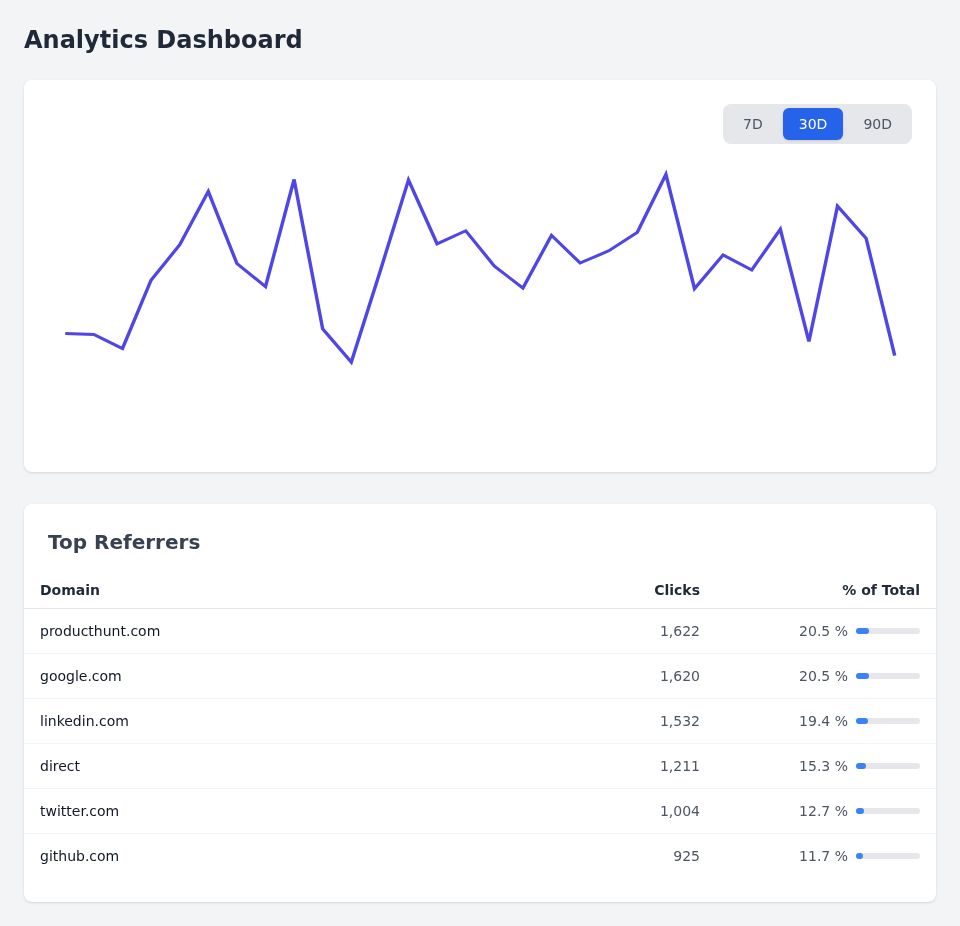
Time Series and Referrers Design
This Blazor analytics dashboard visualizes time-series traffic and top referrers with Tailwind CSS layout. It uses a custom SVG time series chart, interactive period toggle buttons, and a referrer list with percentage bars.
●
LIVE DEMO
Generated using
Instruct UI - An AI for Blazor UI Generation
Related Showcases
UI Page Creation
By Tigran ict
Bootstrap
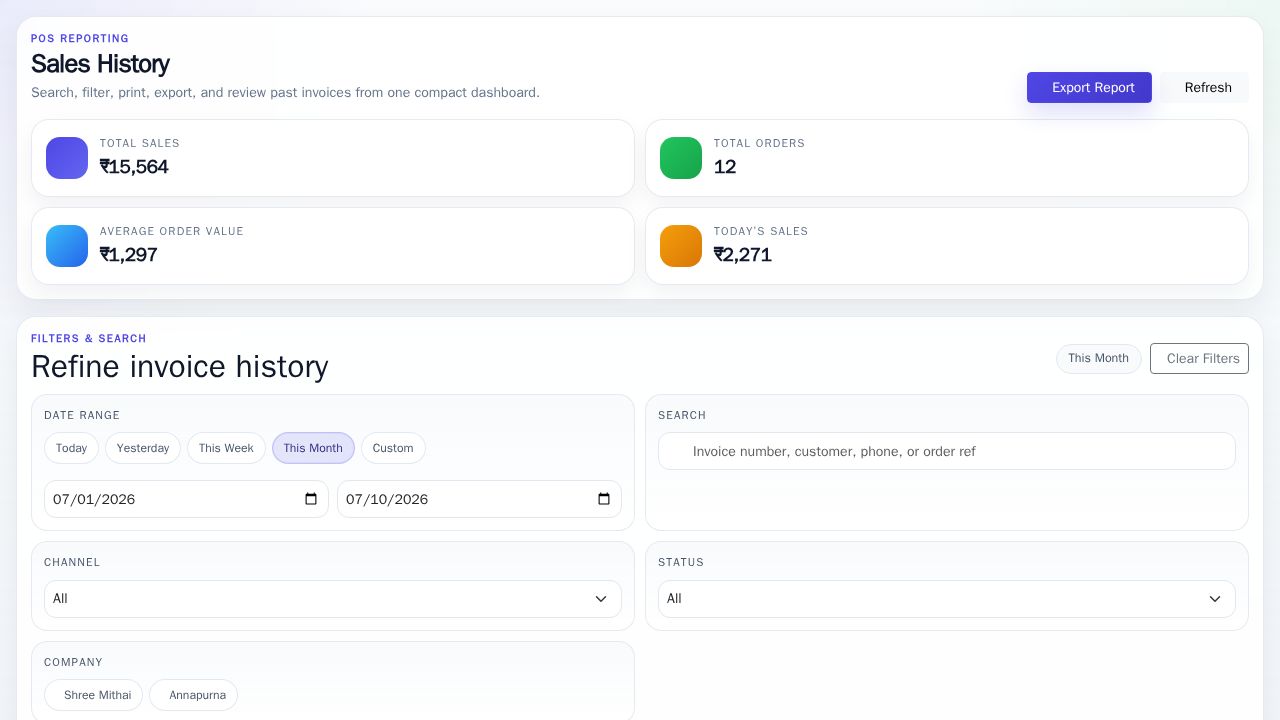
POS Dashboard Layout
By Tyler Durden
Angular
Bootstrap
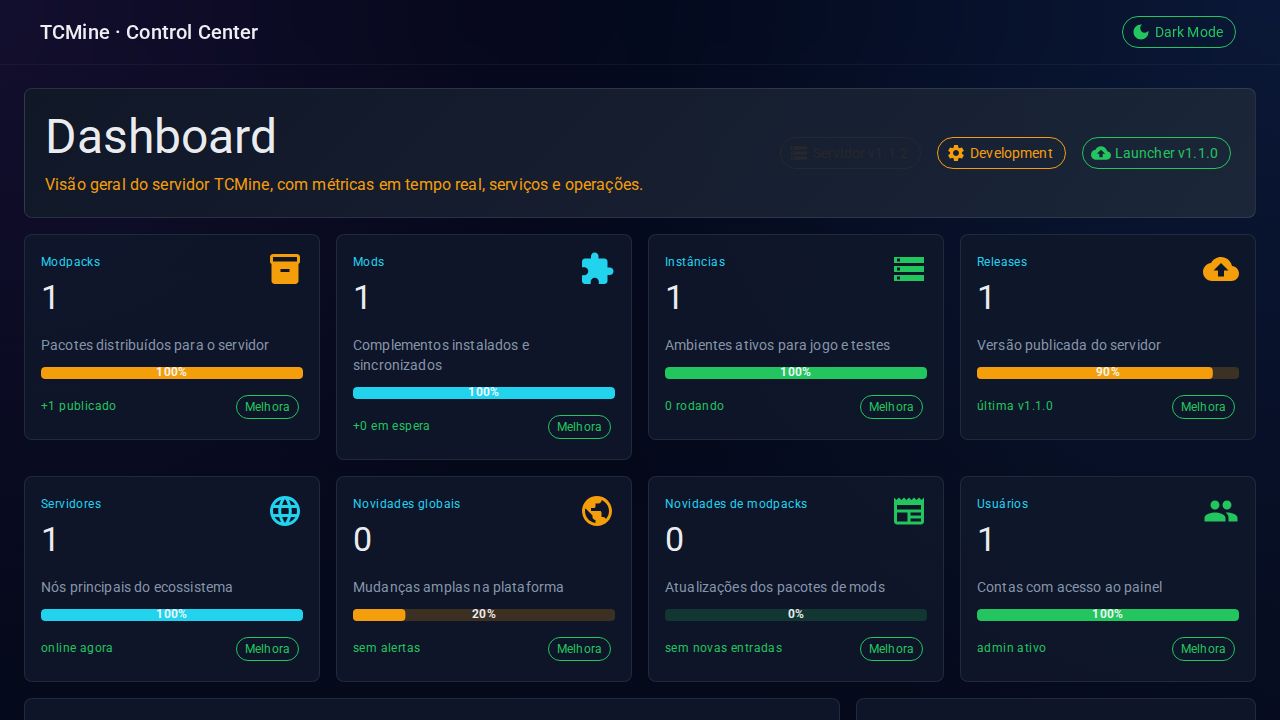
Professional Dark Dashboard
By Jocian Mendonça
MudBlazor
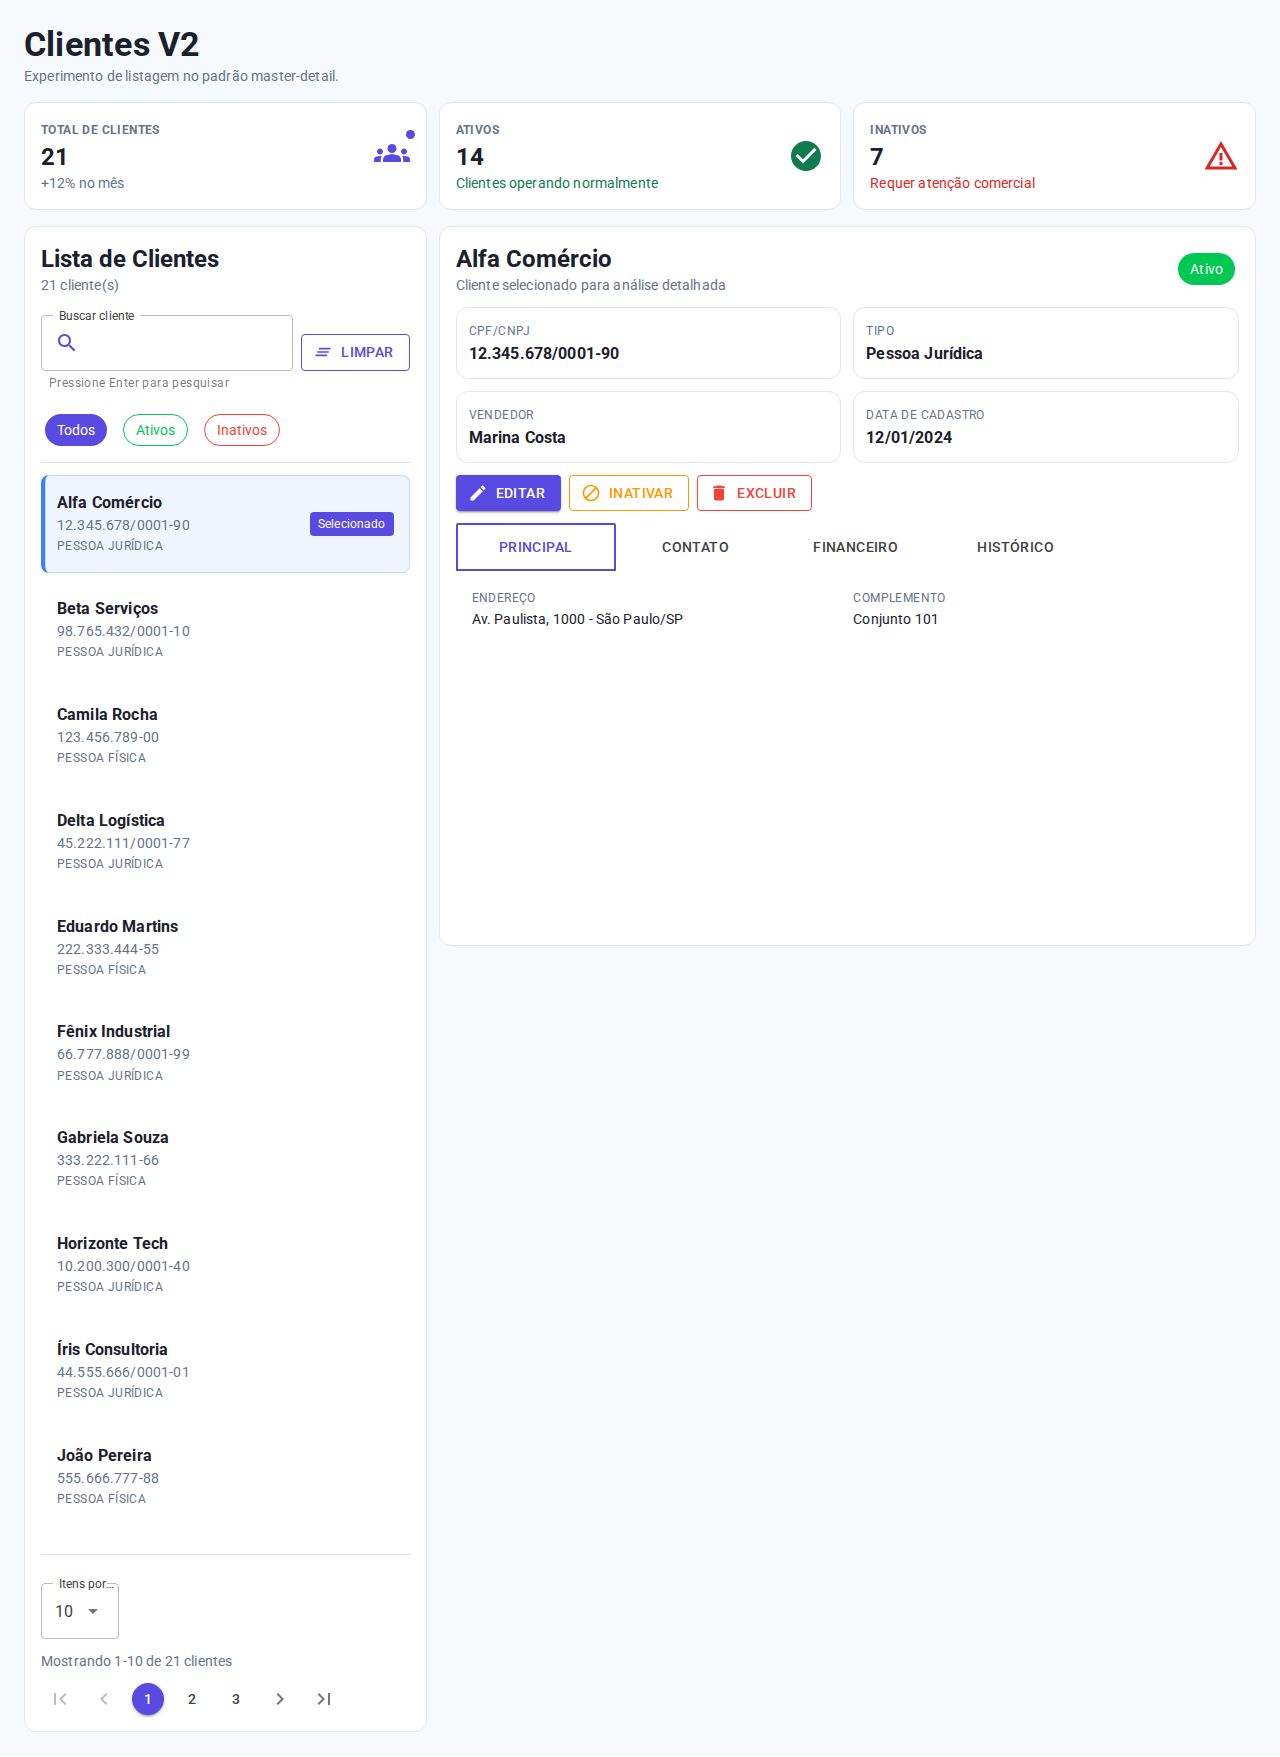
SAP Fiori Client List V2
By tony ricardo sampaio alves pereira chagas
MudBlazor
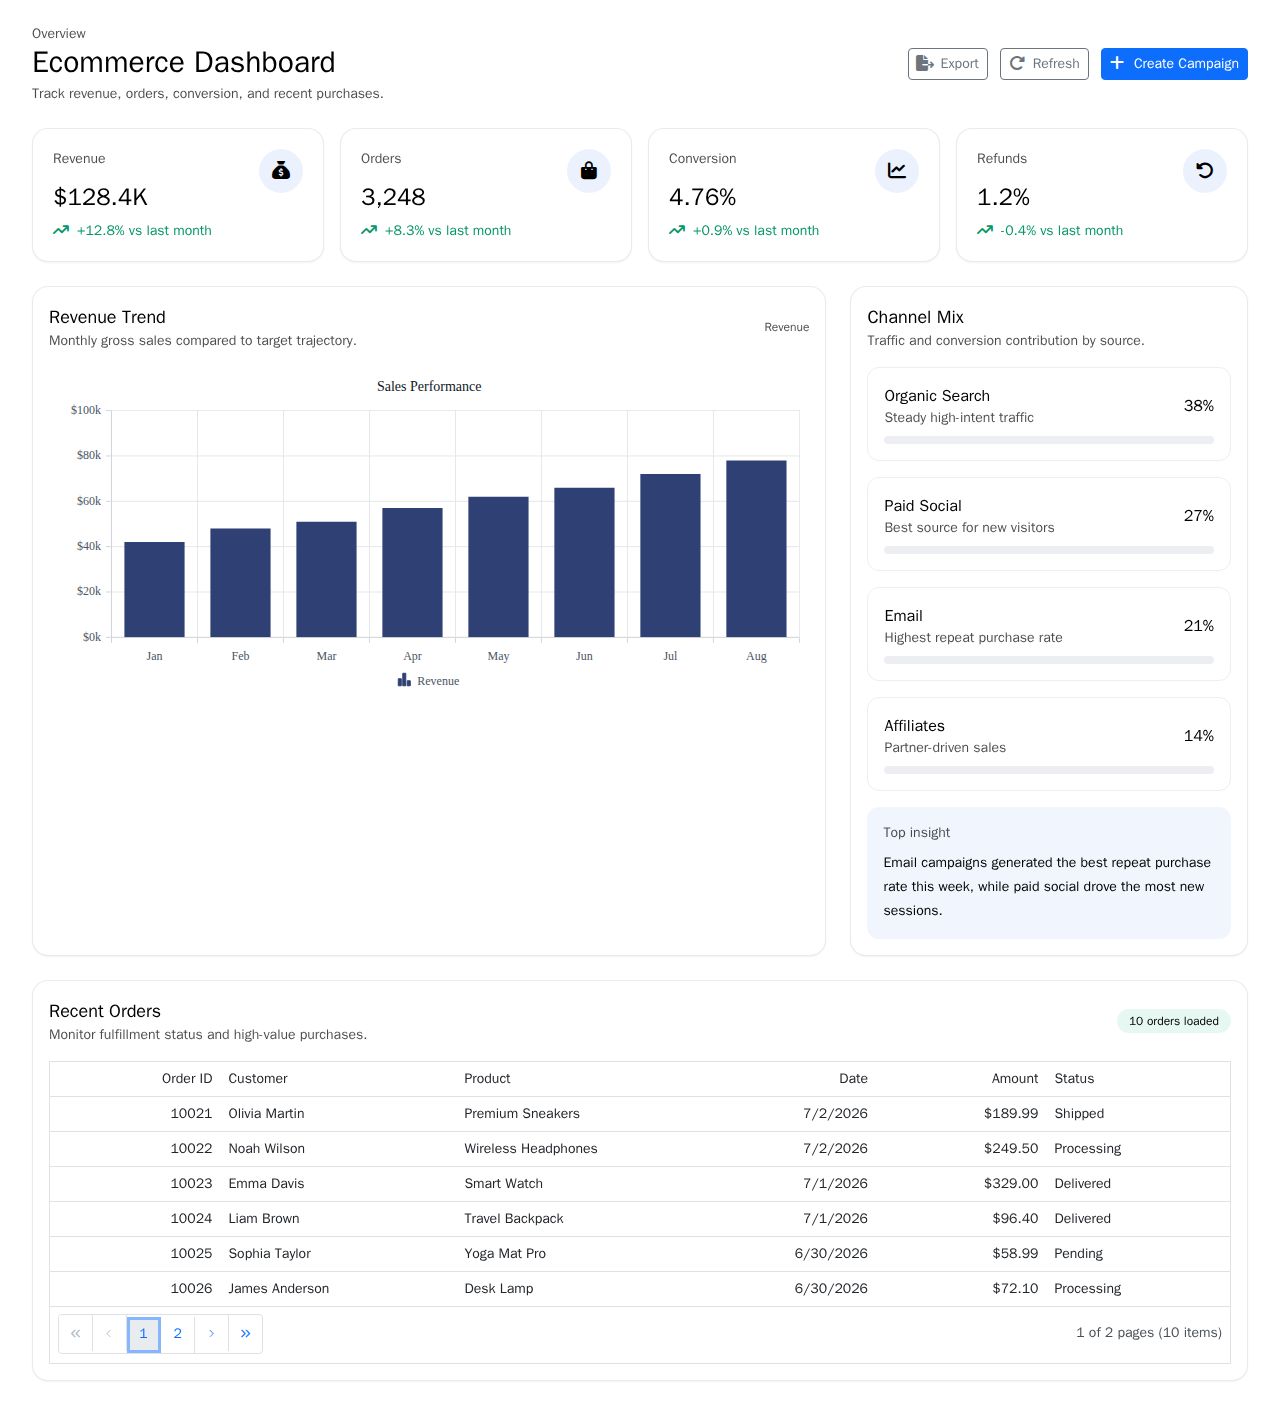
Ecommerce Dashboard Design
By vignesh sivaji
Syncfusion
Tailwind CSS
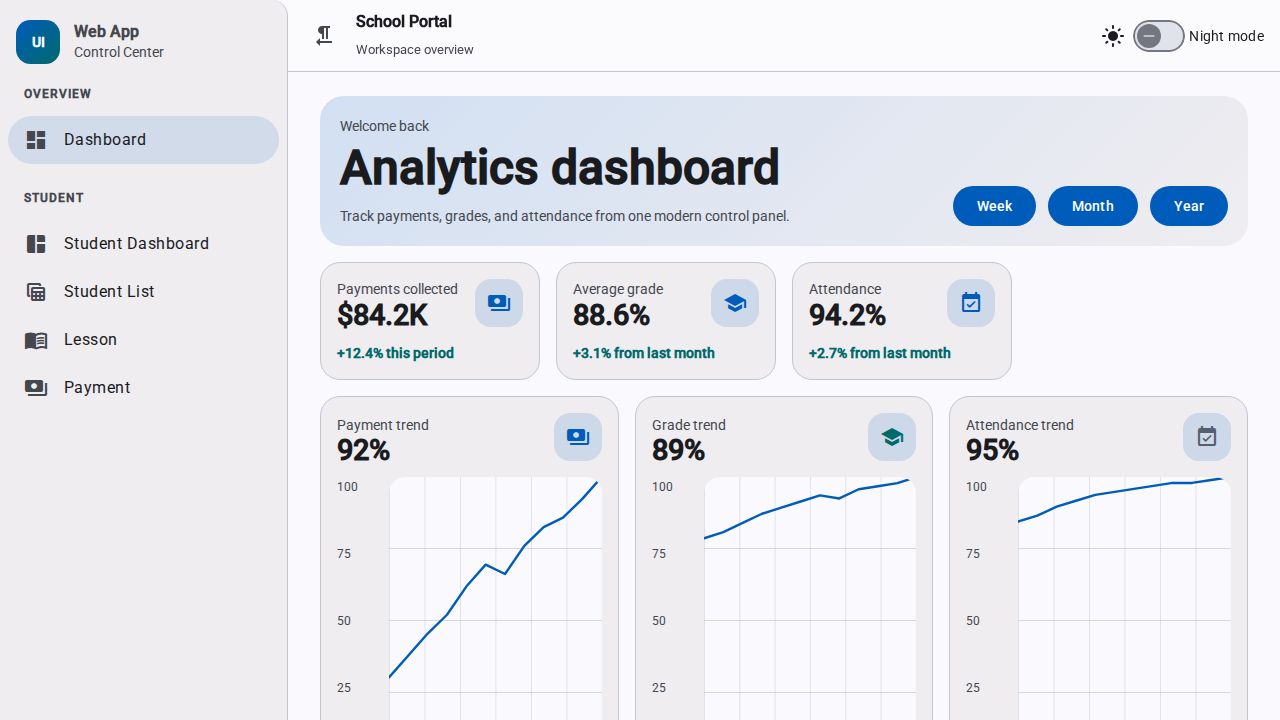
Web App Layout Design
By חנוך גינזבורג
Angular Material